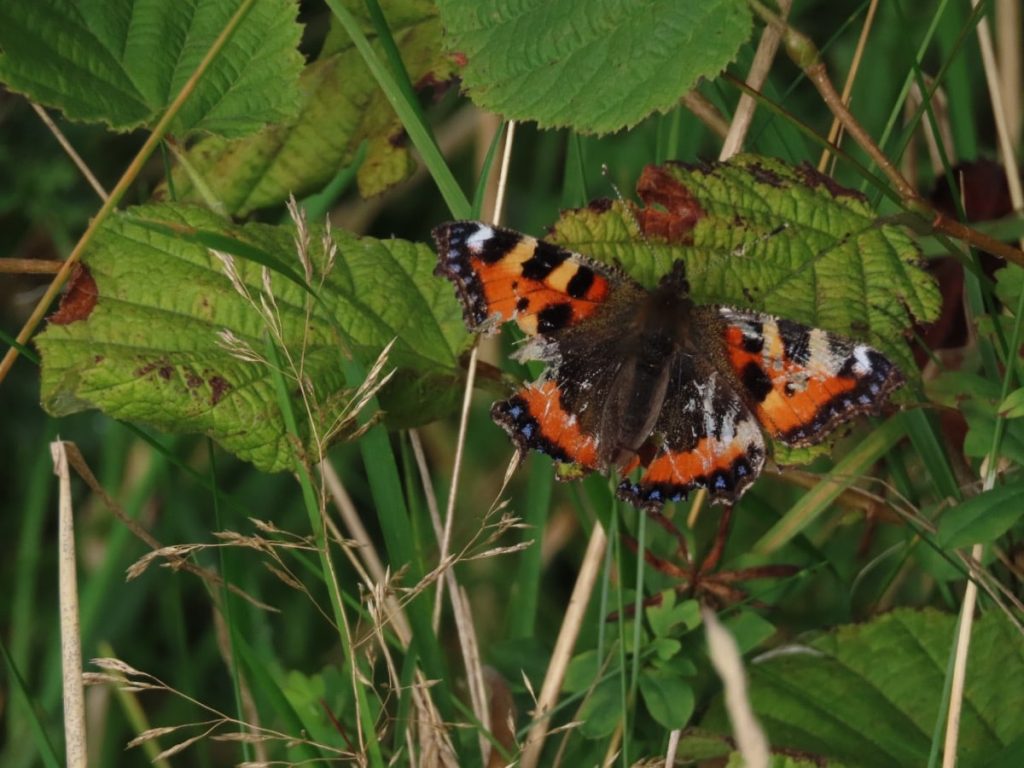
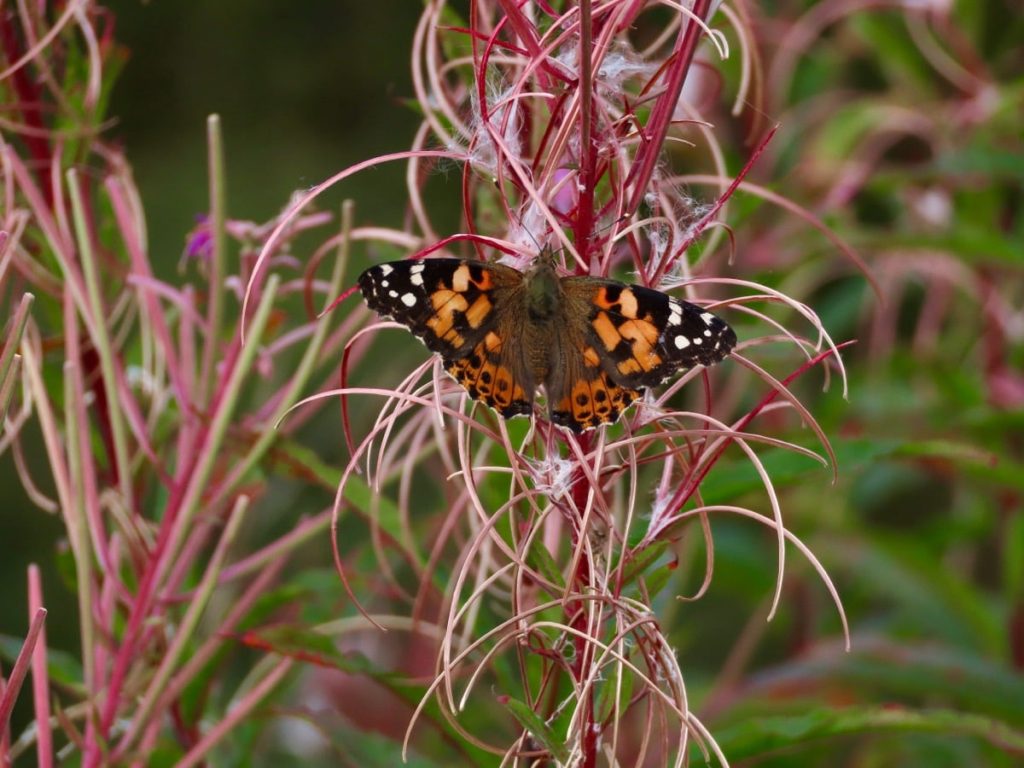
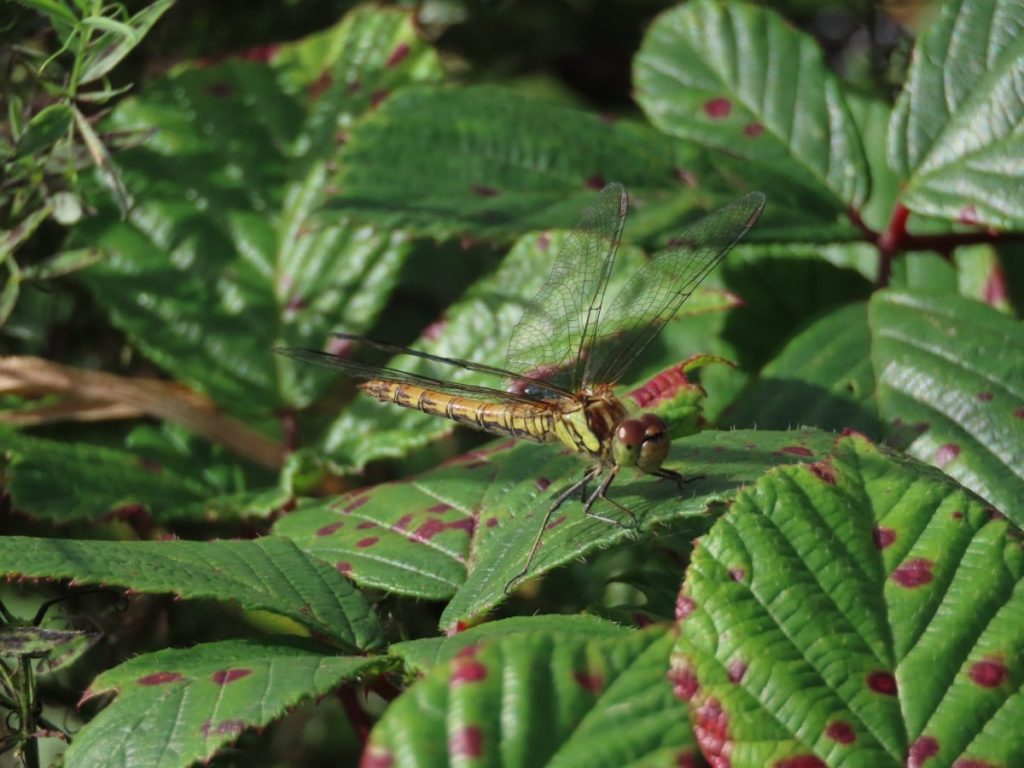
Today’s daily create #tdc5280 #ds106 #dailycreate #ShowYourStripes point toward the #ShowYourStripes webpage that very neatly shows

visual representations of the change in temperature as measured in each country, region or city over the past 100+ years

The site also links to #BiodiversityStripes

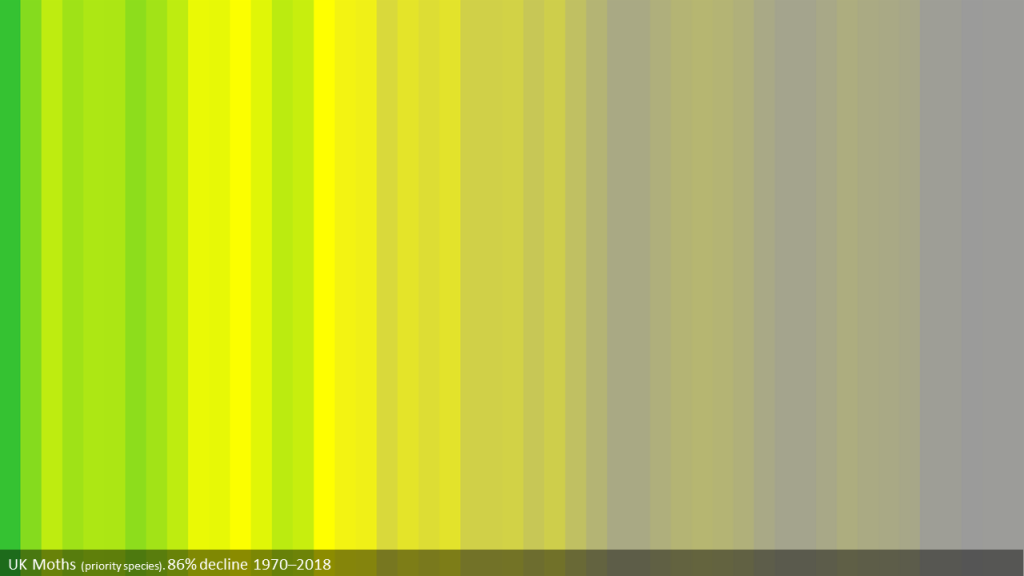
The ‘biodiversity stripes’ provide a visual representation of the change in biodiversity over time, often since 1970. The highest level of biodiversity is coloured bright green. Lower levels move through yellow to grey, depending upon the level of decline. Darker greys appear with greater declines.

This one shows the decline of UK moths from 1970 to 2018

An image showing the decline, 86%,  in British moths from 1970 to 2018  The highest level of biodiversity is coloured bright green. Lower levels move through yellow to grey, depending upon the level of decline. Darker greys appear with greater declines.

86% decline in only part of my lifetime. Horrific. I was 12 in 1970, I remember when cleaning insects from a windshield was a thing.

In 2025, the now-annual survey conducted by Buglife in Kent found a decline of 66% in flying insects since 2021.

Kent bug splat survey shows ‘troubling’ fall in flying insects – BBC News

I am currently reading Aurochs and Auks by John Burnside, a wonderful book, which in part deals with the feelings around this terrible state of affairs.

Reposted https://twitter.com/bdsdragonflies/status/1145779407744831488 by British Dragonfly Society (Twitter)

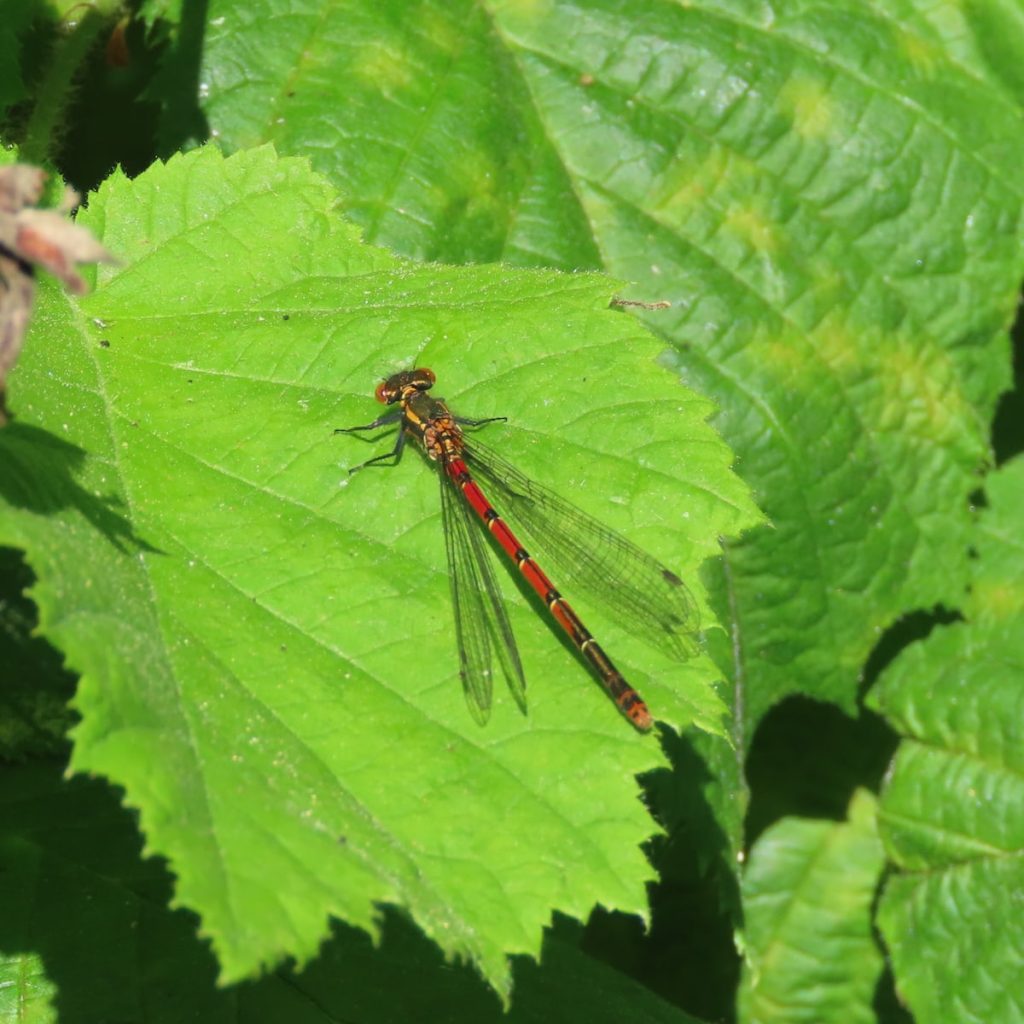
#DragonflyChallenge2019 LEARN: FAQ we get ”How do you tell a Dragonfly from a Damselfly?" If they fold wings down thier sides when perched you are watching a Damselfly. If they hold them out straight like the wings of an areoplane it’s a Dragonfly https://bit.ly/2ROoQne pic.twitter.com/8AS4wXwwUD

https://twitter.com/bdsdragonflies/status/1145779407744831488