Saw this on DaringFireball.
DirectLinks – Canisbos is a Safari extension. Really useful for copying links from Google Search results. Update 6 Sep 2021: extension is gone, se DF for details, link now to archive. Ironic that the link goes to spam sites now.

Normally when you try and copy a link from a google search you get this sort of thing:
https://www.google.co.uk/url?sa=t&rct=j&q=&esrc=s&source=web&cd=2&cad=rja&uact=8&ved=0CCwQFjABahUKEwjq9YnOtOPHAhXxS9sKHUQDB-k&url=https%3A%2F%2Fen.wikipedia.org%2Fwiki%2FFolktale&usg=AFQjCNHDEzwkM43l294OJ6AptxA7_Gg1pw&sig2=Lnf3ewVtFjbDOa7bl3SosA

As google wraps the link so that they can count clicks. Installing the DirectLinks extension means if I copy the same link I get:
https://en.wikipedia.org/wiki/Folktale

Which is a lot more useful.  A quick google finds ways of doing this in Firefox and chrome too. I’ve not tested those.

Draftback is a Chrome extension that lets you play back any Google Doc’s revision history (for docs you can edit). It’s like going back in time to look over your own shoulder as you write.

from: Get Draftback to Play Back Google Docs

The above is not a video but an embed from Draftback!

Quite amazing, in the short playback above you can see how horrible a typist I am and also see Ian Stuart adding text to the document at the same time as me!

After I posted on G+ this Martian Hawksey commented with a link How I reverse-engineered Google Docs to play back any document’s keystrokes « James Somers (jsomers.net). Which give detail of the creation, a fascinating read.

The data that Google stores is, as you might expect, kind of incredible. What we actually have is not just a coarse “video” of a document — we have the complete history of every single character. Draftback is aware of this history, and assigns each character a persistent unique ID, which makes it possible to do stuff that I don’t think folks have really done to a piece of writing before.

And among explanations that go over my head things like this:

When you’re using Google Docs, you’re not actually typing into where you think you’re typing. You’re typing into a textarea in an iFrame off-screen, and through the postMessage API, those events are being sent to the “edit surface” that you see, which does stuff like draw your cursor. (Your cursor on Docs isn’t actually a cursor, it’s a 2px-wide div!)

from: How I reverse-engineered Google Docs to play back any document’s keystrokes « James Somers (jsomers.net)

Would this be a useful tool in the classroom? For discussing pupil work or demonstrating writing?

Replied to Futzopublicus is my Dackolupatoni (CogDogBlog)
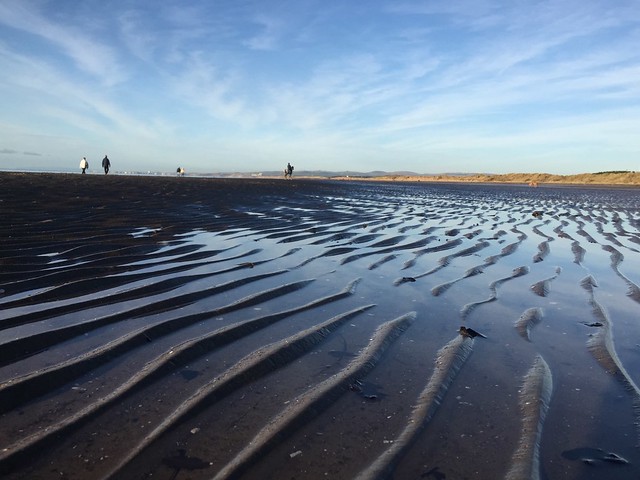
This was in fact a fabulous part of my presentation, and opportunity to show the time honored DS106 tradition of messing up (aka “futzing”) in public- Futzopublicus. So do be a favor, see how we can change the distribution of sand grains, use “Futzopublicus” online now.

So do be a favor, see how we can change the distribution of sand grains, use “Futzopublicus” online now.

from: Futzopublicus is my Dackolupatoni

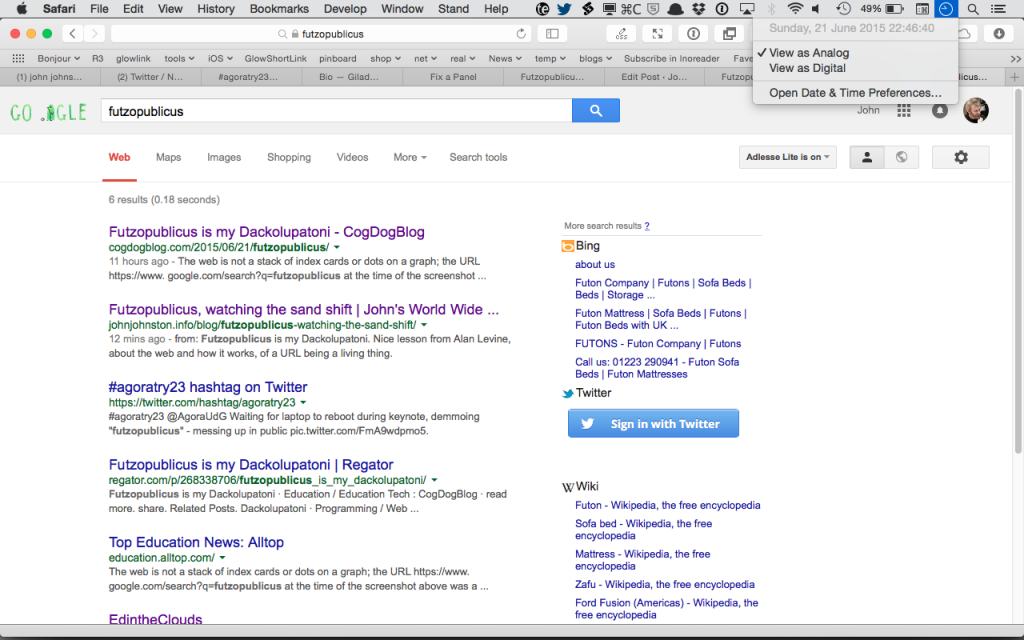
Nice lesson from Alan Levine, about the web and how it works, of  a URL being a living thing.

Just joining in to see how this ripples, but it would be an interesting lesson with a class:

  1. Who can find a word that is not searchable?
  2. How fast can we make it searchable?

Untitled


Update 10 minutes after posting:

Screen Shot 2015-06-21 at 22.46.40

I had a a couple of nice example of how well google image search can work with uploaded images and a couple of descriptive words. Here is one.

While walking today I saw clouds of butterflies, although I tried to get a good photo I failed miserably.

This was the best one:

red-argus-poor

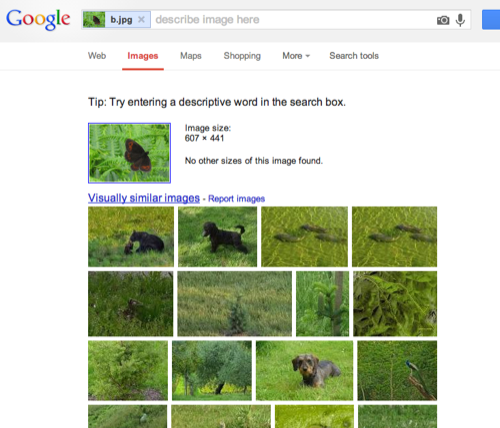
I uploaded this to the google image search, which gave me good feedback on my photo skills:

Gresult 1

Google thinks my butterfly is a bear, dog or fish!

The addition of a few keywords nails it:

Gresult 2

A google wrinkle worth teaching I think.

Lots of information about glow and glow2 trickling through twitter recently. There seems to be a change in timescale for Glow2. This was discovered: View Notice – Public Contracts Scotland which is a strange way to find out about the change, especially after Mike Russell’s initial announcement how Glow will be developed in September 2012 on YouTube. That announcement and the following summit last October lead me to expect more regular and open engagement.

Glew

On monday Charlie Love sent me an interesting link and which I then discussed tonight on Radio EDUtalk, after which Charlie tweeted:

Glew Tweet

What is Glew

Glew is beta software of a single sign-on framework which can be used to integrate Google Apps for Education and other services such as WordPress Blogs, Media Wiki, Moodle and many more. This is a test site so please accept that authentication and users may be removed during testing.

So pretty much a glow 2 style site with a lot of tools I’d expect from Glow 2. Although a Beta you get a really good idea of how this would work. The most interesting feature, to me was the expandability of the site, I asked Charlie about the possibility of adding a wiki to the feature set, in 15 minutes he had added a MediaWiki (the software used in Wikipedia!)

Glew

I highly recommend you pop over to Glew and have a look around.

Hopefully the 15 months that the Government have to work on glow will let them build something like this, if I was the Cabinet Secretary I’d give Charlie a call.

I usually think I can google with the best of them but I am coming round to thinking twitter is quicker!

Yesterday I was working on a wee document on how asus netbooks running linux could be used in class. (I hope to add some more stuff to Doug’s google presentation soon). The webcan can record video nicely, but the files are .ogg ones. On the machine i was using there was no video editing software so I was thinking of moving the video onto a mac to edit. I started googling ogg to mov and the like but didn’t find a result. I figured the ffmpegx might do the trick, but installing that app is not straightforward. So I tweeted: anyone know how to convert ogg video on a mac. can only get VLC to view simple solution prefered at 3:32 PM. By 3:34 PM rogbi200 had tweeted @johnjohnston http://handbrake.fr will convert most things!, followed by one from atstewart and two from jimhenderson.

Handbrake works a treat, is easy to install.

Today, still working on the asus, transferring screen-shots via pen drive to a mac for documentation, I could not see how to eject the disk, right click had no eject. I tweeted atstewart and twowhizzy replied. Again I had spent a few minutes googling. Again twitter was quicker.

My tongue is in my cheek of course, I’ve probably run dozens of google searches over the last two days which have got me what I wanted, twitter seems a good option when you can’t find what you want.

Friday afternoon I saw this tweet: Twitter / tombarrett: “Three Interesting Ways to … from Tom Barrett and popped over to the google presentation on using your Pocket Video Camera in the Classroom. At that point there were three ways and a few folk in the chat. I got an invite from Tom and when I got home I added a slide, by that time there were four ideas so mine made five, I added another later in the evening. By this morning there are nineteen ideas in the slide deck and there have always been a few folk viewing the presentation when I’ve checked it. As I get ready to post this there are 21 ideas. There has also be a ton of tweets linking to the presentation.

Tom has a wonderful ability to get these things rolling through his extensive twitter network. The shared google presentation idea is a great idea, Tom has used it before: Thirty-Eight Interesting Ways (and tips) to use your Interactive Whiteboard and a couple on google earth, as has Doug Belshaw with Interesting Ways to use Netbooks in the Classroom.

What is about these efforts is the amount of collaboration that they attract, much more tha, for example my own efforts. I think part of the secret is probably the low bar to add to the resource. I guess it took me about 2 or 3 minutes to add the first of my slides and about 90 seconds for the second. This is a lot more reasonable than expecting folk to create a wiki page and fill it up. Google Slides are pretty straightforward, no need to read the docs, the technology is pretty transparent. The other part of the secret is, of course, Tom’s excellent use of twitter and the respect he has earned from educators around the world, I can’t wait for his next idea.

I’ve been quite interested in finding out how my iPhone could be used in teaching and learning. last week I and my class making GPS MathTracks inspired by the LearningTracks flickr group and Tom, Andrew and David‘s ideas about Art tracks and spelling with a trackstick. I also read Ollie’s post about Geography Fieldwork with the iPhone.

What I did

Yesterday I was going for a walk and tried out a few ideas with the phone. This is not of course the same as using it with a class but gave me some food for thoughts.

The first thing that I did was record the point of the walk with SnailTrail with which is is simple to collect points and mail them out of the phone. these can be put into a kml template to create a kml file that you can view in google earth or upload and show in google maps. The google map example here show that one or two points went astray. It is easy enough to review these in google earth and remove them. (edit example).

I took a series of photos with the iPhone, these were uploaded to flickr today and automatically placed on the map: Glengoyne to Earl’s Seat set on the map this is a pretty straightforward was of getting the photos onto the map. You could also use the flickr description to add text, the note facility etc as well as discuss the pictures with the comments.

Next I took the photos got the location from the Exif data in the files, I used this to create a kml file and combined that with the snail trail. I also added the time taken and an occasional title to the kml file. I am not sure of the best way of doing this, I made a wee supercard project to script most of this.

Which produces this kml file and looks like this in google maps

The project is pretty rough at the moment and I am sure there are applications out there for doing this, but I wanted to learn a little more about kml files. This sort of thing could be a way of displaying findings for a trip or outdoor activity.

I tweeted occasionally while walking, this produces a list of tweets on Twitter Search as I was using twitterific it was easy to add locations and photos to the tweets, I guess the RSS feed could be parsed to show the pictures and locations or mini maps.

I also added a few notes with YouNote, this application lets you take photos, write notes, record audio and even sketch with a finger. Which would cover most of what you would need on a field trip or excursion. Future editions will let you email notes to get them out of the phone. At the moment you can sync or backup your notes via a desktop application. This results in a zip file on your computer, inside are folders for each note containing multi-media material and xml files with descriptions this information includes geo locations. I suppose that a script could be written to combine this media and xml to create a web page/ map / kml file.

I feel younote is approaching what I would like to see in an iPhone application, if it was combined with a blogging facility or export to a webpage with media it would be ideal.

So what I would like to see would be a combination of the thinks I’ve tried that saved and exported in a usable format. I’ve looked at a few of the blogging application but not found one that does what I want yet.

What I want

My idea application would allow the recording and combining of information in many forms, text, photos and audio recording. It would automatically add location and date and time information. These could be published to a blog and geo rss feed, either on the go, or at a later time if connection to the network is poor. It would be match with a desktop publishing application, this would get the data and media from the phone and allow additions, editing and mashing up, it would output in a multitude of formats.

I’d also like some additions to the iPhone itself:

  • Copy and paste
  • A camera that can take close ups: I often take photos of flora, fauna, fungi and bones I’d like to take close ups, it might be worth testing putting a magnifying glass in front trick.
  • Video
  • Temperature recording
  • A compass on the Map application
What I’d use it for

The obvious thing is geography, but I would be more likely to use it for art and maths tracks as mentioned above. It could also be used to record any outing, not one that covers space on a map. I’d love to do a poetry or painting walk, where a class would record reactions to surroundings, typing would probably be limited to haiku(ideal for snapshot poems), but longer ones could be recorded. A class trip to the beach could spark drawing, writing and photos to produce an online gallery.

In the huge number of iPhone apps now available my ideal application may exist, if it does let me know.

edutwits_exhibit_tiles

Edu Twits is a pretty quick and dirty test of creating a no-code-mashup in the style of Non-Programistan and an exploration of how far you can get creating a useful tool without really reading the manual.

I am not suggesting Edu Twits is all that useful, but I can image how we could use this in the classroom in interesting ways.

Background
I mentioned Exhibit yesterday and made a wee test exhibit of EU data, in the same way as I imagined my class would be able to do. In my imagination:

  1. I’d start a spreadsheet with the correct column headers
  2. Put together a webpage to pull the data via exhibit.
  3. The children would research the required info (wikipedia)
  4. the children would add the info to the spreadsheet, directly or via a form
  5. The children would query the webpage to compare EU countries.

Which seemed fine. Then Tom’s comment:

The pure spreadsheet can be confusing and does look intimidating but with the data entry wrapped in a nice friendly form you?re looking at a much more pleasant interaction (and the ability to restrict choices some for data integrity)- all good things.

got me thinking about data entry a little more. A form seemed the way to go, but my class do not have individual email accounts and I could not send them individual invites to a google docs form.

A quick google gave the the idea that a google form could be embedded in an iFrame. I wanted to test this out with real people rather than just add a lot of data myself (avoiding boredom and rsi), so I though of inviting educationalists from twitter to add themselves to a exhibit. This seemed to be a fair test of data entry.

Implementation

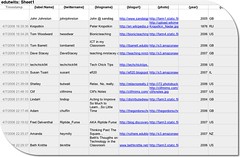
  1. edutwits_spreadsheet The spreadsheet: all I did was set up a Google Spreadsheets, I set the first Row to:
    {label:Name} | {twittername} | {blogname} {blogurl} | {photo} | {year} | {iso} | {latlon} | Notes
    following the Exhibit instructions, you need to property names in the first row, with curly brackets round ’em, the first must be {label}. The spreadsheet is set to publish.
  2. I then set up a web page using the information from Exhibit Authors based on the EU test from the day before. If you know a wee bit of html is is pretty simple to copy-paste-adjust the example pages. also because the editing is done in html it is easy to check the Exhibit examples and view source to find out how to use the straightforward stuff. The Getting Started page should get of off and running, combined with the from a Google Spreadsheet guide if you are going to use a spreadsheet. Part 2 of this post will go into the html in a bit more detail, if anyone is interested.
  3. Using the share tab on the spreadsheet, I set up a form and emailed it to myself.

    I’ve invited you to fill out the form ” edutwits ” which can be accessed at the following link: http://spreadsheets0.google.com/viewform?key=pIE8c8hh-DgLLHXJQQ8eEfQ&email=true

    This form can be used to update the spreadsheet. I filled in the first couple of rows on the spreadsheet and sent off an invite to a couple of folk to try out. At that point I discovered a couple of mistakes, I had {year] as a column header and the form posted the locations to the wrong column, the first was easily fixed and for the second I just moved the location column header to the column that the form was filling in. I probably should find out a bit more about google forms.

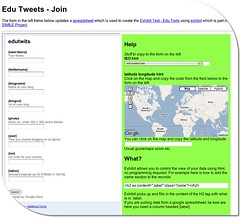
  4. I then embedded the google form in an iframe on a webpage:

    edutwits_exibit_add-form2 I added a popup to get iso country codes from the name of countries, borrowed for a wee google chart experiment (that helped get the maps and flags onto the exhibit too), and a link to an old page for getting latitude and longitude from a google map.
    Later on the form was improved by moving stuff around a bit and adding the location map to the actual page rather than opening in a new window.
    One problem is that the iso codes and locations need to be copied from the form on the right to the google form on the left, but it seems to work.
    At this point (well before the form improvements, I tweeted inviting folk to try the mashup out).
  5. The tweet was picked up by a few folk, one Tom Barrett who has a considerably bigger network than me, Tom’s retweeting has done much to spread the word., at the time of writing 34 folk are on the Edu Twits page.

Initial conclusions

  1. Exhibit and google spreadsheets make it fairly easy to create a usable database.
  2. Editing via a form works for adding new data, but users can’t get in to make changes once data is submitted.
  3. Out the box google forms lack validation, I don’t know if using the data api would be any better?
  4. I am keen to try this with a class(es) as I believe it will meet some of the curricular targets for using databases (and it is fun.)

Blue Sky
so far I’ve not broken any Non-Programistan guidelines, other than the addition of the google map. This could have been avoided (at least for the US) by using the address to location translation the Exhibit seems to provide. the next bit might overstep the mark a little.

  1. Use google data api to build forms that would add and edit users data, load form in password protected page to stop folk messing with others stuff.
  2. Add validation and auto addition of locations, iso codes etc. to said form.
  3. php to create new spreadsheets and templates for exhibit displays.

In this case blue sky means ‘I have no idea what I am talking about, maybe someone has already done this stuff, maybe it can’t be done‘.

Next steps

  • Try this out in class after the holidays, use EU idea.
  • Try a combo with another class.

If you got all the way to the foot of this page you might want to add yourself to the app.
You could let me know if part 2: details of the little I’ve learned about the html bit of Exhibit, is wanted.
Many thanks to the folk who have added themselves so far, and if you want your details changed, let me know.

Looking back on this post before I fire it off it seems even more of a mixed bag than usual. As usual fairly garbled, but the first half contains some wonderful links and the second what looks to me to be a great resource.

I spent the first part of yesterday morning (and the last hour or so this morning) following a trail that either started in a tweet from cogdog or a post recent addition to my feed reader.
Tony Hirst’s OUseful Info is a great source of ‘mostly over my head’ mashup info and other stuff, eg: We Ignore RSS at OUr Peril or « feedshow – A Feed Powered Web Page Presentation Tool

To Comrades in Non-Programistan – A Message from Feedistan included a great youtube: DataPortability and Me (Get Your Data Out!) and had me laughing. It also pointed to The Party Line of The Peoples Republic of Non-Programistan which was created (as far as I can see) to support a presentation at the Symposium on Mashups, you an watch the recording of the Welcome to the People?s Republic of Non-Programistan session which features laugh out loud fake Russian accents.

The point of the Non-Programistana is to open up mashups to non-coders, although they will allow some html. They point to Exhibit and give interesting examples: Industrial Warfare – Version 4.

This lead me to Exhibit part of MITs SIMILE Project:

SIMILE is focused on developing robust, open source tools that empower users to access, manage, visualize and reuse digital assets.

Exhibit can be used to

Create interactive data-rich web pages

and there are some great examples that can be popped from the Exhibit homepage.

I have been talking to some Glasgow colleagues about filling the 5-14 database gap that has appeared when we got upgraded to windows xp. I had suggested a few online examples that children could use for querying databases and Zoho Create for creating databases. While the querying examples went down well, Zoho seemed too imageless for catching primary children’s imagination. It also look a little like a spreadsheet for some teachers. likewise lazybase.

Exhibit looked like it might fill this gap, so I’ve spent the rest of yesterday morning playing with it. The Getting Started tutorial is very straightforward and will allow you to work through an example on your own desktop. I started with an idea from our own curriculum, information about the EU. The idea is that the children could research basic facts about the EU and add them to a google spreadsheet. With the number of countries in the EU a fair sized class could get one country each.
Exhibit allows you to build a simple html page which will read the spreadsheet webpage and create an interactive database. Amazingly it allows multiple views including a nice timeline and table views. One of the Exhibit examples incorporated famfamfam.com flag icons, interestingly these are name with ISO 3166-1 alpha-2 country codes, I could add a column to the spread sheet and include these, it was the easy to show the flag on the records:

I have been playing with Google chart maps, which use the same iso code so it was simple enough to add these.
Anyway in a couple of hours i was able to put together a google spreadsheet and a Exhibit Test. The latter will need more work, but you can get the idea. I think this will work in class and hope to try it out next term. I need to know a bit more about logging on multiple uses with the same ip address to a spreadsheet, but I hope to quiz Tom Barrett about that. I also need to find out a bit more about creating forms for google speadsheets.

The workflow would go like this:

  1. I’d start a spreadsheet with the correct column headers
  2. Put together a webpage to pull the data via exhibit.
  3. The children would research the required info (wikipedia)
  4. the children would add the info to the spreadsheet, directly or via a form
  5. The children would query the webpage to compare EU countries.

At the moment this would only work as a one off, a webpage would have to be created for each time the lesson was carried out for a class. A quick look at the Google Spreadsheets Data API would suggest you could create a spreadsheet automatically, by uploading a blank this could then be loaded by a hph version of the Exhibit Test page which would dynamically load different spreadsheets (with the same headers). Unfortunately this would violate the Party Line of The Peoples Republic of Non-Programistan, and more realistically be beyond my limited skills.

As I just wrote at the start of this post, it is a bit of a rag bag, but it tells the tale of my Sunday morning’s fun, following a web of links and playing with a great tool. In the afternoon I went for a walk