Since my last walk map post I’ve made a bit of progress. I am now using Trails an iPhone app that:

allows you to record, import and export tracks onto your iPhone.

Trailsscreen

Trails is really nice, it records and show position and altitude. It also allows you to cache map tiles when you have a good connection to use later on a walk.
You can zoom in quite close and it has already been handy in finding out I was going the wrong way in the mist.

Trails allows you to email a track in both kml and gpx format. Clicking the kml file opens the trail in GoogleEarth.

I’ve been using GPSPhotoLinker a free app to add geotags to photos using the gpx track from Trails. Once you have dome that they will be mapped by flickr.

I’ve then been using .SuperCard to read the data from the photos and the gpx track and produce an xml file and set of resized photos. The xml files can be used with the google maps api to show the track and photos on a google map.

I’ve started to put together some webpages to list and show the maps: Mapped Walks.

Walklist tn

The idea is to end up with a SuperCard project that cuts out some of the steps, it would take in photos and gpx file and upload resized photos and xml file to the web. I just need a bit of time to write and test the scripts.

I have managed to add an mp3 player to some of the google bubbles on one map that plays sound recorded on my phone. The aim is to have pictures, audio video and text. The maps now also have links in the bubbles that take you from one to the next in the correct order, I think this could be come an interesting way to tell a story that travels through space and time.

Every Trail

I decided to try a new approach to plotting photos on a map today and use EveryTrail which according to the site:

With this geotracking application, you can record your movements, take geotagged photos, make notes and immediately upload it all to EveryTrail, the leading online community for travel storytelling

The weather was not very nice so i just went a short way from home to the Kilpatrick hills. I started walking and took some photos with EveryTrails as I went, it seemed a smooth and well crafted application. After about 20 minutes I decided I could not remember if I had locked the car to turned around to check. I clicked stop and save in the app and as I was looking at the field to fill in the application quit. On opening it nothing was saved.

On restarting the walk I reverted to using SnailTrail (this application seems to have vanished from the store.)

SnailTrail just lets you save a list of waypoints and email them to yourself. I sure a simple SuperCard project to create the kml file from the list and the photos exif data. I’ve uploaded the the kml file which will open in google earth and imported it into google maps.

googlemapscreenshot

I noticed a strange thing when working with the photos, the ones taken in portrait seemed to have lost their exif data. I drag the photos from iPhoto onto my SuperCard project to get the exif data (Via the exiftags commandline app), it seems when iPhoto rotates the images according to the camera’s instructions it loses the exif data. however if you export the files via iPhoto’s file menu you can check a box to include location and the exif data is in the exported files.

Update 2 March 2009 I was trying to incorporate mp3 sound in the kml file but the object tag is not shown by google maps (it is by earth) so I’ve experimented with the maps API and have markers with pictures and sound: Mapped walk which has some potential I think.

Tracker

I had a very pleasant location experience this week. I had been trying the iPhone app Tracker to ftp a small webpage with my location to the web (example target=”new”), I was then parsing out the data with php to produce a static google map (example). Then the application was upgraded and the structure of the html file was improved, this of course broke my script. I then emailed the developer Stefan Welebny and asked him if he could have an option just to upload the basic information to a text file. Much to my surprise he wrote back and then updated the application. It now will send the information as parameters to a webpage, in my case a php file. at the moment my file just writes that information out to a text file but I hope to soon be able to record my location to a list and then do other things with it. As I understand it Tracker will send its position every 20 seconds so I could use it by turning the app on for a few seconds to record a location.

I’ve been quite interested in finding out how my iPhone could be used in teaching and learning. last week I and my class making GPS MathTracks inspired by the LearningTracks flickr group and Tom, Andrew and David‘s ideas about Art tracks and spelling with a trackstick. I also read Ollie’s post about Geography Fieldwork with the iPhone.

What I did

Yesterday I was going for a walk and tried out a few ideas with the phone. This is not of course the same as using it with a class but gave me some food for thoughts.

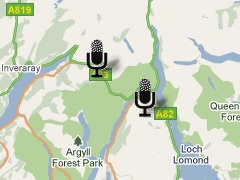
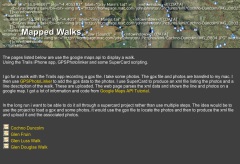
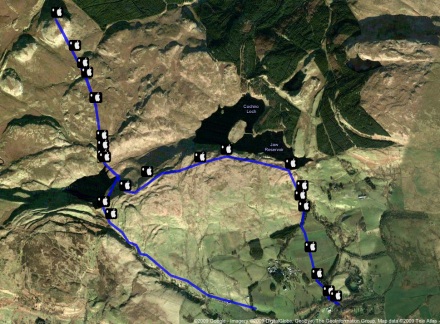
The first thing that I did was record the point of the walk with SnailTrail with which is is simple to collect points and mail them out of the phone. these can be put into a kml template to create a kml file that you can view in google earth or upload and show in google maps. The google map example here show that one or two points went astray. It is easy enough to review these in google earth and remove them. (edit example).

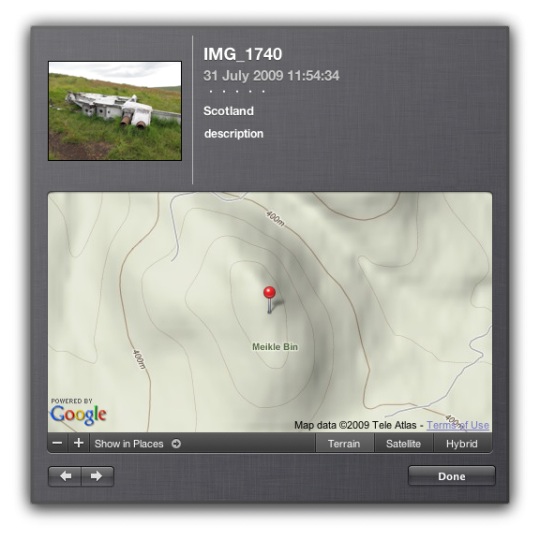
I took a series of photos with the iPhone, these were uploaded to flickr today and automatically placed on the map: Glengoyne to Earl’s Seat set on the map this is a pretty straightforward was of getting the photos onto the map. You could also use the flickr description to add text, the note facility etc as well as discuss the pictures with the comments.

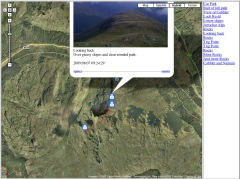
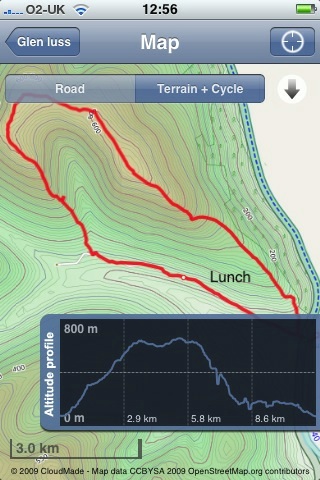
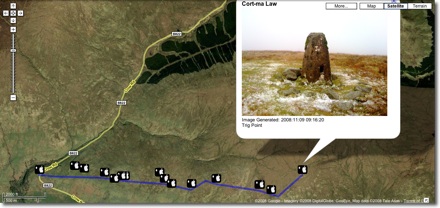
Next I took the photos got the location from the Exif data in the files, I used this to create a kml file and combined that with the snail trail. I also added the time taken and an occasional title to the kml file. I am not sure of the best way of doing this, I made a wee supercard project to script most of this.

Which produces this kml file and looks like this in google maps

The project is pretty rough at the moment and I am sure there are applications out there for doing this, but I wanted to learn a little more about kml files. This sort of thing could be a way of displaying findings for a trip or outdoor activity.

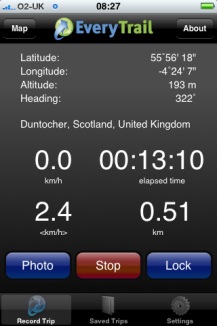
I tweeted occasionally while walking, this produces a list of tweets on Twitter Search as I was using twitterific it was easy to add locations and photos to the tweets, I guess the RSS feed could be parsed to show the pictures and locations or mini maps.

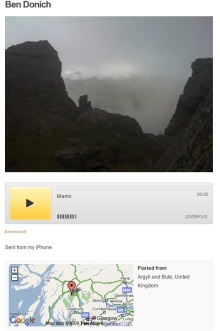
I also added a few notes with YouNote, this application lets you take photos, write notes, record audio and even sketch with a finger. Which would cover most of what you would need on a field trip or excursion. Future editions will let you email notes to get them out of the phone. At the moment you can sync or backup your notes via a desktop application. This results in a zip file on your computer, inside are folders for each note containing multi-media material and xml files with descriptions this information includes geo locations. I suppose that a script could be written to combine this media and xml to create a web page/ map / kml file.

I feel younote is approaching what I would like to see in an iPhone application, if it was combined with a blogging facility or export to a webpage with media it would be ideal.

So what I would like to see would be a combination of the thinks I’ve tried that saved and exported in a usable format. I’ve looked at a few of the blogging application but not found one that does what I want yet.

What I want

My idea application would allow the recording and combining of information in many forms, text, photos and audio recording. It would automatically add location and date and time information. These could be published to a blog and geo rss feed, either on the go, or at a later time if connection to the network is poor. It would be match with a desktop publishing application, this would get the data and media from the phone and allow additions, editing and mashing up, it would output in a multitude of formats.

I’d also like some additions to the iPhone itself:

  • Copy and paste
  • A camera that can take close ups: I often take photos of flora, fauna, fungi and bones I’d like to take close ups, it might be worth testing putting a magnifying glass in front trick.
  • Video
  • Temperature recording
  • A compass on the Map application
What I’d use it for

The obvious thing is geography, but I would be more likely to use it for art and maths tracks as mentioned above. It could also be used to record any outing, not one that covers space on a map. I’d love to do a poetry or painting walk, where a class would record reactions to surroundings, typing would probably be limited to haiku(ideal for snapshot poems), but longer ones could be recorded. A class trip to the beach could spark drawing, writing and photos to produce an online gallery.

In the huge number of iPhone apps now available my ideal application may exist, if it does let me know.

edutwits_exhibit_tiles

Edu Twits is a pretty quick and dirty test of creating a no-code-mashup in the style of Non-Programistan and an exploration of how far you can get creating a useful tool without really reading the manual.

I am not suggesting Edu Twits is all that useful, but I can image how we could use this in the classroom in interesting ways.

Background
I mentioned Exhibit yesterday and made a wee test exhibit of EU data, in the same way as I imagined my class would be able to do. In my imagination:

  1. I’d start a spreadsheet with the correct column headers
  2. Put together a webpage to pull the data via exhibit.
  3. The children would research the required info (wikipedia)
  4. the children would add the info to the spreadsheet, directly or via a form
  5. The children would query the webpage to compare EU countries.

Which seemed fine. Then Tom’s comment:

The pure spreadsheet can be confusing and does look intimidating but with the data entry wrapped in a nice friendly form you?re looking at a much more pleasant interaction (and the ability to restrict choices some for data integrity)- all good things.

got me thinking about data entry a little more. A form seemed the way to go, but my class do not have individual email accounts and I could not send them individual invites to a google docs form.

A quick google gave the the idea that a google form could be embedded in an iFrame. I wanted to test this out with real people rather than just add a lot of data myself (avoiding boredom and rsi), so I though of inviting educationalists from twitter to add themselves to a exhibit. This seemed to be a fair test of data entry.

Implementation

  1. edutwits_spreadsheet The spreadsheet: all I did was set up a Google Spreadsheets, I set the first Row to:
    {label:Name} | {twittername} | {blogname} {blogurl} | {photo} | {year} | {iso} | {latlon} | Notes
    following the Exhibit instructions, you need to property names in the first row, with curly brackets round ’em, the first must be {label}. The spreadsheet is set to publish.
  2. I then set up a web page using the information from Exhibit Authors based on the EU test from the day before. If you know a wee bit of html is is pretty simple to copy-paste-adjust the example pages. also because the editing is done in html it is easy to check the Exhibit examples and view source to find out how to use the straightforward stuff. The Getting Started page should get of off and running, combined with the from a Google Spreadsheet guide if you are going to use a spreadsheet. Part 2 of this post will go into the html in a bit more detail, if anyone is interested.
  3. Using the share tab on the spreadsheet, I set up a form and emailed it to myself.

    I’ve invited you to fill out the form ” edutwits ” which can be accessed at the following link: http://spreadsheets0.google.com/viewform?key=pIE8c8hh-DgLLHXJQQ8eEfQ&email=true

    This form can be used to update the spreadsheet. I filled in the first couple of rows on the spreadsheet and sent off an invite to a couple of folk to try out. At that point I discovered a couple of mistakes, I had {year] as a column header and the form posted the locations to the wrong column, the first was easily fixed and for the second I just moved the location column header to the column that the form was filling in. I probably should find out a bit more about google forms.

  4. I then embedded the google form in an iframe on a webpage:

    edutwits_exibit_add-form2 I added a popup to get iso country codes from the name of countries, borrowed for a wee google chart experiment (that helped get the maps and flags onto the exhibit too), and a link to an old page for getting latitude and longitude from a google map.
    Later on the form was improved by moving stuff around a bit and adding the location map to the actual page rather than opening in a new window.
    One problem is that the iso codes and locations need to be copied from the form on the right to the google form on the left, but it seems to work.
    At this point (well before the form improvements, I tweeted inviting folk to try the mashup out).
  5. The tweet was picked up by a few folk, one Tom Barrett who has a considerably bigger network than me, Tom’s retweeting has done much to spread the word., at the time of writing 34 folk are on the Edu Twits page.

Initial conclusions

  1. Exhibit and google spreadsheets make it fairly easy to create a usable database.
  2. Editing via a form works for adding new data, but users can’t get in to make changes once data is submitted.
  3. Out the box google forms lack validation, I don’t know if using the data api would be any better?
  4. I am keen to try this with a class(es) as I believe it will meet some of the curricular targets for using databases (and it is fun.)

Blue Sky
so far I’ve not broken any Non-Programistan guidelines, other than the addition of the google map. This could have been avoided (at least for the US) by using the address to location translation the Exhibit seems to provide. the next bit might overstep the mark a little.

  1. Use google data api to build forms that would add and edit users data, load form in password protected page to stop folk messing with others stuff.
  2. Add validation and auto addition of locations, iso codes etc. to said form.
  3. php to create new spreadsheets and templates for exhibit displays.

In this case blue sky means ‘I have no idea what I am talking about, maybe someone has already done this stuff, maybe it can’t be done‘.

Next steps

  • Try this out in class after the holidays, use EU idea.
  • Try a combo with another class.

If you got all the way to the foot of this page you might want to add yourself to the app.
You could let me know if part 2: details of the little I’ve learned about the html bit of Exhibit, is wanted.
Many thanks to the folk who have added themselves so far, and if you want your details changed, let me know.

On Thursday this week I’ll be off to Georgia for a long weekend visit.

Carol Fuller of Sammy McClure, Sr. Middle School is being honored by Woodruff Arts Center in the Woodruff Salutes Georgia Arts in Education Leaders (pdf) scheme for her work with us on the Dream Dragon where her students from Cobb High School wrote a play based on some Sandaig Poems. (among other things).

On Saturday I am going to go to the award ceremony and on the Friday and Monday I am going to visit Sammy McClure, Sr. Middle School. I am hoping to do some collaborative work between my class and the students there. I started a blog, McClure – Sandaig to support this, hopefully it will be an interesting read. We will try to post updates on the pupil activities and I hope to post during the trip so that my class can follow what I am doing. In case of connectivity problems I’ve made a sort of moblog too.

I had quite a lot of fun setting up the blog (and a related one, more of which if it works) and moblog in the early hours of Saturday. The moblog just pulls down photos from flickr, which is the easiest moblog app I’ve found. Of course flickr is blocked in school so the webpage downloads the photos to the Sandaig site if they are not there and shows them from there. I hope to adapt that idea for out forthcoming Dutch trip with primary 7 this May too.

I am also hoping to be able to update the map and use Flashmeeting to have a wee chat with my class at some point during the trip, time difference and holidays allowing. I thought briefly about using seesmic to talk to my class, but am not even sure if we can access it in school and it might open a can of worms. I think there might be a wee podcast too.

Of course this is not so much a plan as a wish list, but I’ll be trying my best to both enjoy meeting Carol for the first time, visiting a school in the USA and getting as much value for my own class as I can.

I’ve updated my Sandaig Google Maps Experiment a little this weekend, getting ready for some international co-operation this session I hope.

I added a few schools and a wee popup control to the page to point to the school chosen.

the interface I made for editing the maps proved far too clunky for children to use, so I’ve been thinking of redoing that as a step by step process.

The questions are at the end feel free to skip down there if you know anything about gps.

I spent quite a while over a year ago messing with the google maps api. eventually I made an interface for creating maps, uploading photos and placing them on the map. This gave me a lot of fun, but I found it too time consuming for children to use.
The earlier this year Google My Maps came out which was a lot neater than my effort, and I’ve used it a few times, mostly pasting in the links flickr provides to add photos.

Cort-ma-Law from Lecket hill This week I stared another one with a few photos from a walk.
I was a bit frustrated about placing the photos on the map as I found it hard to figure out where place where in the rather featureless Campsies.

Flickr map Sorry

I switched to using flickr own maps but found them it a bit slow (that might be my aging mac).
I found it even more difficult to get the photos placed with any accuracy on flickr maps, although the interface for adding and looking at the photos is very slick, especially when you grab a bunch of pictures and throw them on a single spot.
Perhaps I just do not go far enough so need to much detail on a map to make my walk look like a walk rather than a spot.

All this made me think about my previous experiments, especially as there was an article in macuser about using the flickr and google maps apis combined. I had just finished using phpflickr to make a community gallery so though this might be quite quick.

Unfortunately the macuser article relies on a flickr api flickr.photos.geo.getLocation which depends on you having placed the photo on the flickr map (I was beginning to go round in circles).

Then I remembered Adam Burt‘s Applescript for getting geo tags from Google Earth ready for pasting into flickr. Adam does amazing things with blogs, google Earth/maps and geoblogging.
The appleScript copies to the clipboard geo tags of the location showing on google earth at that time.
It is much easier to figure out where you are on google earth, it has a smoother gui than google maps and a better resolution (of where I was at least). so I geotagged a bunch of photos, grabbed a new google maps API key and got busy.

Flickr googlemap mashup

Of course at that time I didn’t know about flickr.photos.geo.getLocation depending on flickr maps.And I didn’t know a tag geo:lon=-4.704382114809 would be returned from the API as machine_tags=”geo:lon=4704382114809 geo:lat=56258859999999″ ie without the minus sign or point so I spent a fair bit of time staring at a blank map, as the google maps API didn’t understand what I was sending to it. Anyway to cut a very long afternoon short, I delved deeper than I had been before into the data returned from flickr.photos.getInfo and finally clunked together a couple of files, the first uses phpflickr to grab the info from flickr and store it in a file, the second pulls that info using the google maps api and create a map.
I did try pulling the information and creating the map all at once, but that took too long. The data from flickr obviously does not need to be updated very often so that job was hived off, speeding up the maps creation. The unfinished product is here: John’s Flickr Map Mashup.

This is just scratching the surface of what could be done, it would be better maybe to create different maps for different days or for particular tags. if all of my tagged photos go on the same map it might eventually be too crowded and need some pagination.

Help wanted: I’d like to know a bit more about geo tagging and perhaps GPS:

  1. Would it be possible to get data from a GPS device and add it to the EXIF data of a photo before uploading it?
  2. Does Flickr undersatand embeded gps data?
  3. Is there a cheap enough GPS device that would work with a mac?

I am thinking of a work flow that includes the tagging of photos before uploading, maybe in iphoto with AppleScript or a SuperCard project, I think I’ve done some EXIF data extracting so imagine that adding can’t be that much harder.

Any ideas that do not involve a lot of expense gratefully received.