Edu Twits is a pretty quick and dirty test of creating a no-code-mashup in the style of Non-Programistan and an exploration of how far you can get creating a useful tool without really reading the manual.
I am not suggesting Edu Twits is all that useful, but I can image how we could use this in the classroom in interesting ways.
Background
I mentioned Exhibit yesterday and made a wee test exhibit of EU data, in the same way as I imagined my class would be able to do. In my imagination:
- I’d start a spreadsheet with the correct column headers
- Put together a webpage to pull the data via exhibit.
- The children would research the required info (wikipedia)
- the children would add the info to the spreadsheet, directly or via a form
- The children would query the webpage to compare EU countries.
Which seemed fine. Then Tom’s comment:
The pure spreadsheet can be confusing and does look intimidating but with the data entry wrapped in a nice friendly form you?re looking at a much more pleasant interaction (and the ability to restrict choices some for data integrity)- all good things.
got me thinking about data entry a little more. A form seemed the way to go, but my class do not have individual email accounts and I could not send them individual invites to a google docs form.
A quick google gave the the idea that a google form could be embedded in an iFrame. I wanted to test this out with real people rather than just add a lot of data myself (avoiding boredom and rsi), so I though of inviting educationalists from twitter to add themselves to a exhibit. This seemed to be a fair test of data entry.
Implementation
-
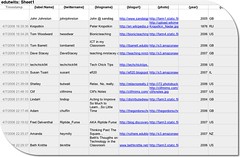
 The spreadsheet: all I did was set up a Google Spreadsheets, I set the first Row to:
{label:Name} | {twittername} | {blogname} {blogurl} | {photo} | {year} | {iso} | {latlon} | Notes
following the Exhibit instructions, you need to property names in the first row, with curly brackets round ’em, the first must be {label}. The spreadsheet is set to publish. - I then set up a web page using the information from Exhibit Authors based on the EU test from the day before. If you know a wee bit of html is is pretty simple to copy-paste-adjust the example pages. also because the editing is done in html it is easy to check the Exhibit examples and view source to find out how to use the straightforward stuff. The Getting Started page should get of off and running, combined with the from a Google Spreadsheet guide if you are going to use a spreadsheet. Part 2 of this post will go into the html in a bit more detail, if anyone is interested.
- Using the share tab on the spreadsheet, I set up a form and emailed it to myself.
I’ve invited you to fill out the form ” edutwits ” which can be accessed at the following link: http://spreadsheets0.google.com/viewform?key=pIE8c8hh-DgLLHXJQQ8eEfQ&email=true
This form can be used to update the spreadsheet. I filled in the first couple of rows on the spreadsheet and sent off an invite to a couple of folk to try out. At that point I discovered a couple of mistakes, I had {year] as a column header and the form posted the locations to the wrong column, the first was easily fixed and for the second I just moved the location column header to the column that the form was filling in. I probably should find out a bit more about google forms.
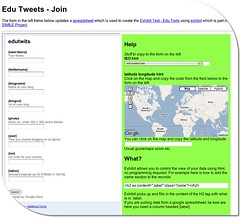
- I then embedded the google form in an iframe on a webpage:
 I added a popup to get iso country codes from the name of countries, borrowed for a wee google chart experiment (that helped get the maps and flags onto the exhibit too), and a link to an old page for getting latitude and longitude from a google map.
Later on the form was improved by moving stuff around a bit and adding the location map to the actual page rather than opening in a new window.
One problem is that the iso codes and locations need to be copied from the form on the right to the google form on the left, but it seems to work.
At this point (well before the form improvements, I tweeted inviting folk to try the mashup out). - The tweet was picked up by a few folk, one Tom Barrett who has a considerably bigger network than me, Tom’s retweeting has done much to spread the word., at the time of writing 34 folk are on the Edu Twits page.
Initial conclusions
- Exhibit and google spreadsheets make it fairly easy to create a usable database.
- Editing via a form works for adding new data, but users can’t get in to make changes once data is submitted.
- Out the box google forms lack validation, I don’t know if using the data api would be any better?
- I am keen to try this with a class(es) as I believe it will meet some of the curricular targets for using databases (and it is fun.)
Blue Sky
so far I’ve not broken any Non-Programistan guidelines, other than the addition of the google map. This could have been avoided (at least for the US) by using the address to location translation the Exhibit seems to provide. the next bit might overstep the mark a little.
- Use google data api to build forms that would add and edit users data, load form in password protected page to stop folk messing with others stuff.
- Add validation and auto addition of locations, iso codes etc. to said form.
- php to create new spreadsheets and templates for exhibit displays.
In this case blue sky means ‘I have no idea what I am talking about, maybe someone has already done this stuff, maybe it can’t be done‘.
Next steps
- Try this out in class after the holidays, use EU idea.
- Try a combo with another class.
If you got all the way to the foot of this page you might want to add yourself to the app.
You could let me know if part 2: details of the little I’ve learned about the html bit of Exhibit, is wanted.
Many thanks to the folk who have added themselves so far, and if you want your details changed, let me know.

